« Home | Emergency Department Overcrowding »
Monday, May 15, 2006
Prediction & anticipation?
Excerpt from the talk by James Adams, M.D., 2002 about 'America's Hospitals: In Danger or Bouncing Back?'
James Adams is Professor and Chief, Emergency Medicine, Northwestern University/Northwestern Memorial Hospital
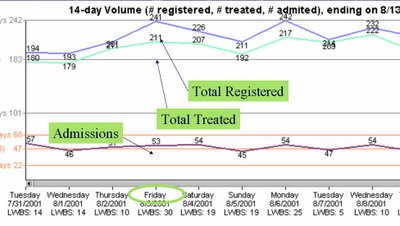
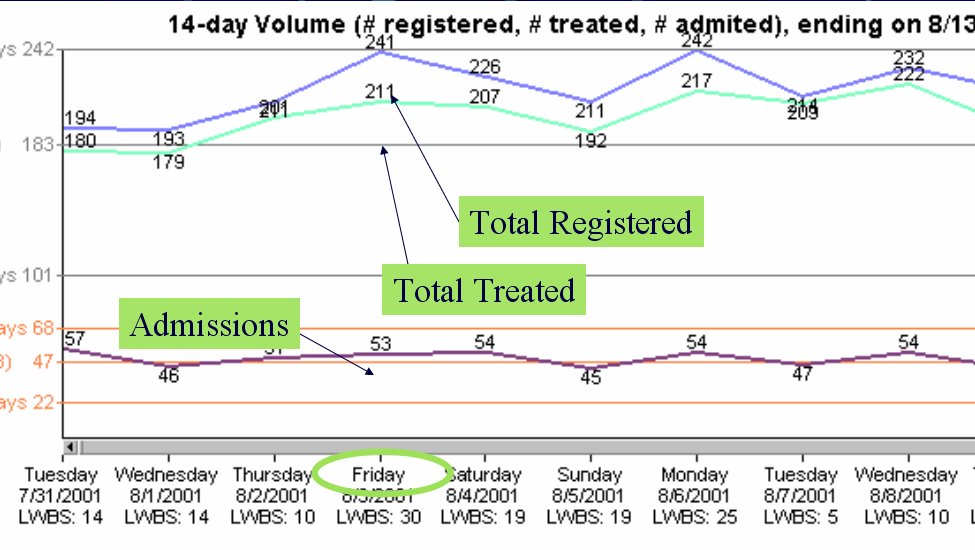
This is an example of a line graph that charts the numbers of patients registered, treated, and admitted to Northwestern Memorial Hospital over a 2 week period. Such a record of numbers can be used to help predict the number of patients admitted through the Emergency Department (ED).
We can predict problems tomorrow by projecting, 24 hours in advance:
* Anticipated ED volume.
* Surgical volume.
* Anticipated discharges.
* Transfers/direct admissions.
* Current hospital volume.
Why would we want to predict problems?
* If we can predict problems that will occur tomorrow, we can respond today.
* If we fail to adequately respond, at least we can:
o Know that we are optimally managing the system.
o Figure out ways to manage better.
o Know that there is simply no capacity!
Once we predict a problem, then what?
* Notify medical staff.
o What do they need?
* Notify managers and key leaders.
o What do they need?
* Prioritize work to be done:
o Labs, radiology.
o Placement, rides home.
How can we begin this process?
* The hospital system must work together as a whole.
* The demands of the ED, including bottlenecks, must be monitored.
o 5 level, ESI Triage.
o Real time process controls.
+ Information tools.
If we monitor the hospital 24 hours in advance of problems, we also must monitor the ED on a real-time basis in order to identify unanticipated problems, bottlenecks, and surges.
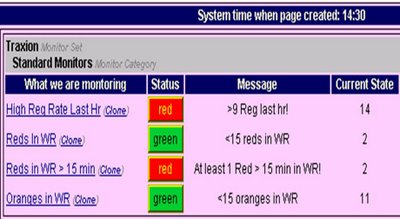
This is a picture of a screen showing a real-time monitoring system report. It shows what is being monitored, the status of that situation, and brief messages regarding that situation.
This is an example of a line graph that charts the numbers of patients registered, treated, and admitted to Northwestern Memorial Hospital over a 2 week period. Such a record of numbers can be used to help predict the number of patients admitted through the Emergency Department (ED).
We can predict problems tomorrow by projecting, 24 hours in advance:
* Anticipated ED volume.
* Surgical volume.
* Anticipated discharges.
* Transfers/direct admissions.
* Current hospital volume.
Why would we want to predict problems?
* If we can predict problems that will occur tomorrow, we can respond today.
* If we fail to adequately respond, at least we can:
o Know that we are optimally managing the system.
o Figure out ways to manage better.
o Know that there is simply no capacity!
Once we predict a problem, then what?
* Notify medical staff.
o What do they need?
* Notify managers and key leaders.
o What do they need?
* Prioritize work to be done:
o Labs, radiology.
o Placement, rides home.
How can we begin this process?
* The hospital system must work together as a whole.
* The demands of the ED, including bottlenecks, must be monitored.
o 5 level, ESI Triage.
o Real time process controls.
+ Information tools.
If we monitor the hospital 24 hours in advance of problems, we also must monitor the ED on a real-time basis in order to identify unanticipated problems, bottlenecks, and surges.
This is a picture of a screen showing a real-time monitoring system report. It shows what is being monitored, the status of that situation, and brief messages regarding that situation.

cati at 1:25 PM