« Home | Growing Demand for Emergency Room Visits AndThe Ad... »
Monday, May 15, 2006
Emergency Department Overcrowding
Excerpt of "Emergency Department Overcrowding and Ambulance Diversion." by Robin Weinick, Ph.D., 2002.
Robin Weinick, PhD., is Director, Intramural Research, Center for Primary Care Research, Agency for Healthcare Research and Quality
What is ED Overcrowding?
* Need for emergency services outstrips available resources in the ED.
* More patients than staffed ED beds, plus long wait times.
* Patients typically treated and monitored in hallways.
* Constrains ability to triage patients.
Measuring Overcrowding
* No established way to measure.
o AHRQ is developing a set of measures.
* Time from arrival to physician contact.
* Number of patients being boarded.
* Boarding time.
* Time on ambulance diversion.
Ambulance Diversion
* Closed to ambulance traffic.
o A symptom, not the primary problem.
* Results in:
o Increased ambulance cycle/response time.
o More first-time patients.
o Forced override.
* Measured by the number of hours on divert.
Percent of Hospitals 'At' or 'Over' Capacity
This bar graph provides percentages of four different types of hospitals that reported being "at" or "over" capacity in 2002. The types of hospitals and the percentage reporting capacity issues are as follows: 79% of all urban hospitals; 45% of rural hospitals; 81% of teaching hospitals; and 56% of non-teaching hospitals. Nationally, 62% of all hospitals reported capacity issues.
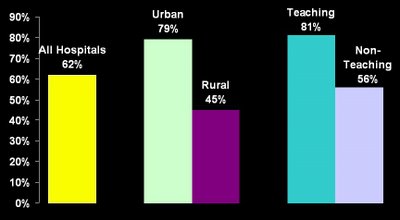
Source: The Lewin Group Analysis of AHA ED and Hospital Capacity Survey, 2002
The percentages of hospitals in the following groupings reported being 'at' or 'over' capacity: 34% of hospitals with less than 100 beds reported problems; 77% of hospitals with 100-299 beds were "at" or "over" capacity; 91% of hospitals with 300-499 beds reported capacity issues; and 90% of hospitals with more than 500 beds had capacity problems. In terms of trauma levels, 87% of level I hospitals reported capacity issues and 79% of level II reported capacity problems.
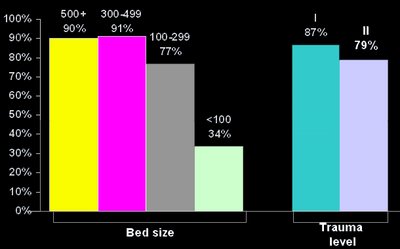
Source: The Lewin Group Analysis of AHA ED and Hospital Capacity Survey, 2002.
How Many ED Visits? 1992-2000
This bar graph tells how many visits were made nationwide to Emergency Departments. The number of visits by year are: 1992: 91 million; 1993: 90 million; 1994; 93 million; 1996: 90 million; 1998: 100 million; 2000: 108 million. The number of ED visits nationally has increased by 20% between 1996 and 2000.
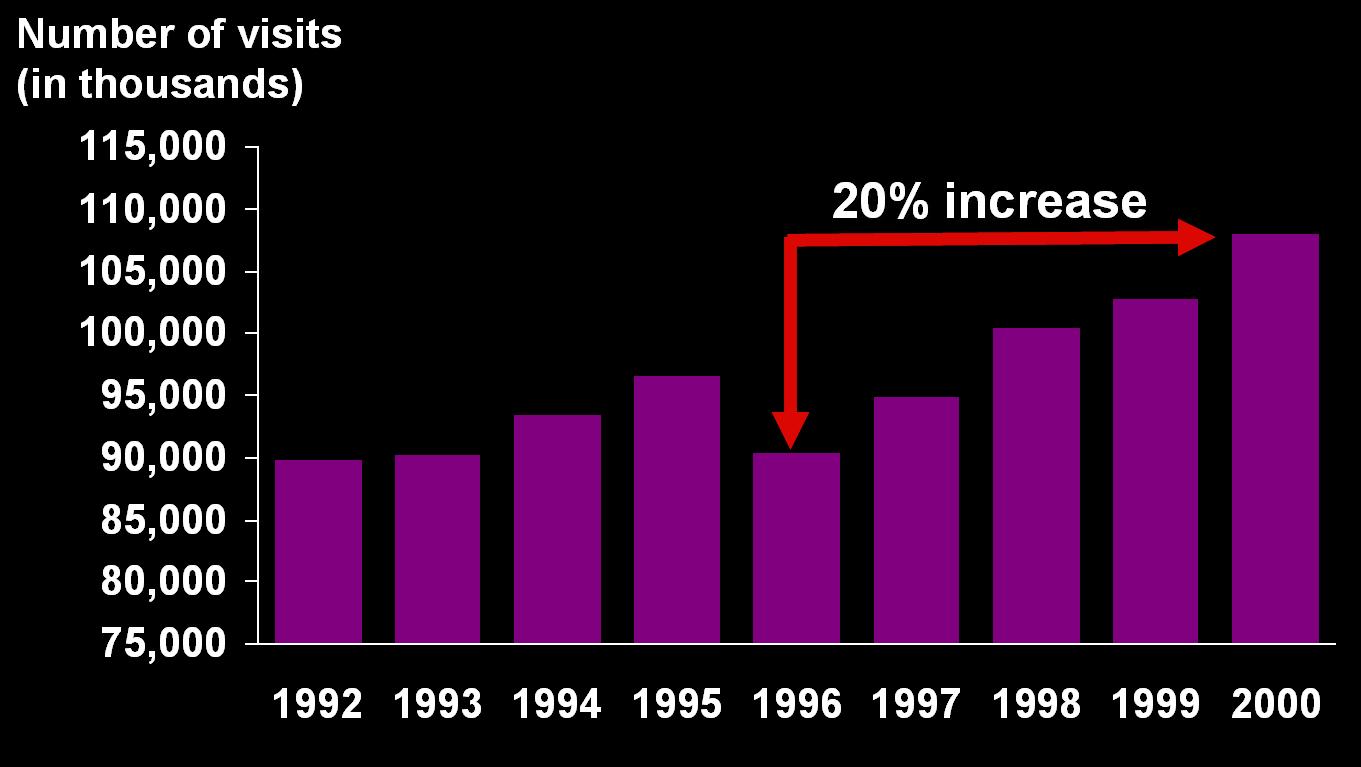
Source: National Center for Health Statistics, National Hospital Ambulatory Medical Care Survey, 1992-2000.
How Many Hospital Beds? 1992-2000
This graph highlights the reduced supply of both hospital beds and Emergency Departments across the nation. From 1992-2000 there was an overall 16% decrease in the number of hospital beds and an 8% decrease in the number of Emergency Departments.
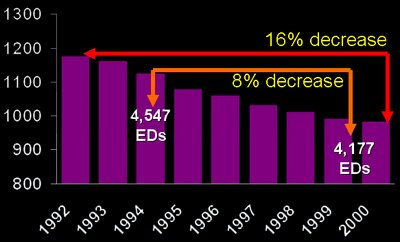
Source: American Hospital Association, Hospital Statistics.
How are Hospitals Staffed?
This graph shows the total number of new Registered Nurse graduates between 1995 and 2000. Highlighted on this slide is the fact that between 1995 and 2000, the number of new RNs has decreased by 26%.
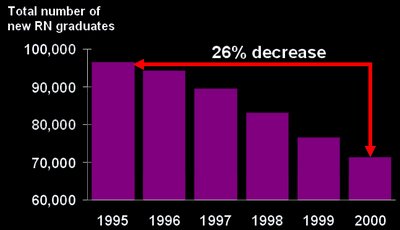
Source: Health Resources and Services Administration, "Projected Supply, Demand, and Shortages of Registered Nurses: 2000-2020."
Source: American Hospital Association, Hospital Statistics.
cati at 12:49 PM